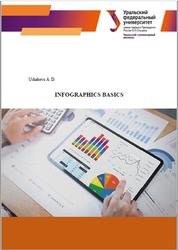
Основная цель электронного учебного пособия «Infographics Basics» -научить студентов представлять результаты научных исследований и проектов ясно и наглядно при помощи инфографики на английском языке.
Пособие может быть полезно бакалаврам, магистрантам и аспирантам, а также всем, кто интересуется инфографикой и хочет научиться эффективно и понятно представлять результаты свой учебной и научной деятельности.
Statistical infographics.
If you want to visualize survey results, present data from multiple sources, or backup an argument with relevant data, then a statistical infographic is the best infographic to do that. A statistical infographic puts the focus on your data. The layout and visuals will help you tell the story behind your data. Your storytelling devices can include charts, icons, images and eye-catching fonts (see Fig. 2.1. and Fig. 2.2.) [31].
Best practices for creating a statistical infographic:
• Look for the story behind your data and reflect that in your design.
• Vary the types of data visualizations you use – like charts, icons, and text.
• Write a descriptive infographic title that contextualizes the data.
• Emphasize key data by using a contrasting colour or pairing the number with an icon [31].
CONTENTS.
1. The history of infographics.
2. Types of infographics.
3. Colour.
4. Charts and diagrams.
4.1. Pie charts.
4.2. Bar charts.
4.3. Line graphs.
4.4. Maps.
4.5. Diagrams.
References.
Бесплатно скачать электронную книгу в удобном формате, смотреть и читать:
Скачать книгу Infographics Basics, Ушакова А.Д., 2023 - fileskachat.com, быстрое и бесплатное скачивание.
Скачать pdf
Ниже можно купить эту книгу, если она есть в продаже, и похожие книги по лучшей цене со скидкой с доставкой по всей России.Купить книги
Скачать - pdf - Яндекс.Диск.
Дата публикации:
Хештеги: #учебник по английскому языку :: #английский язык :: #Ушакова
Смотрите также учебники, книги и учебные материалы:
Следующие учебники и книги:
 Hans von Bülow, A life and times, Walker A., 2010 — Hans von Bülow’s vast legacy, scattered across a wide variety of locations, reflects a life of ceaseless travel. He is … Книги по английскому языку
 Здоровый образ жизни, Опыт разных стран, Войнова Ж.Е., 2023 — Пособие ‘Good health and well-being around the world’ ( Здоровый образ жизни: опыт разных стран ) представляет собой тематический ресурсный … Книги по английскому языку
 Расширяем свой английский словарный запас, Велиева Л.Ф., Зырянова А.В., Павлова О.Ю., 2023 — Настоящее учебно-практическое пособие состоит из 12 глав. Каждая глава содержит лексику определенной тематики и ряд упражнений, направленных на расширение словарного … Книги по английскому языку
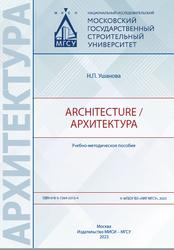 Architecture, Архитектура, Ушанова Н.П., 2023 — Учебно-методическое пособие содержит профессионально-ориентированные тексты и систему лексических и текстовых упражнений, направленных на формирование профессиональной иноязычной компетенции обучающихся. Для обучающихся … Книги по английскому языку
Предыдущие статьи:
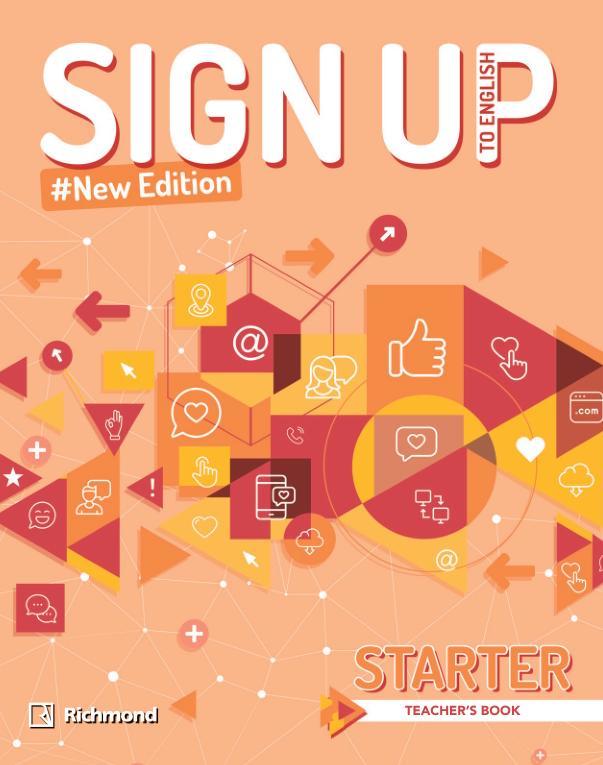 Sign up to English New Edition, Teacher’s Book, Tosi M., 2020 — Sign Up to English New Edition is a fully updated and improved version of the best seller Sign Up to … Книги по английскому языку
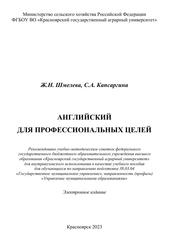 Английский для профессиональных целей, Шмелева Ж.Н., Капсаргина С.А., 2023 — Цель учебного пособия помочь будущим государственным служащим овладеть профессиональной лексикой, сформировать навыки устной речи, аудирования и письма для применения в … Книги по английскому языку
 Упражнения на разницу времен в английском, Тюльников А. — Фрагмент из книги. А теперь сделайте эти предложения отрицательными и вопросительными. 1. Her car is not very expensive Is her … Книги по английскому языку
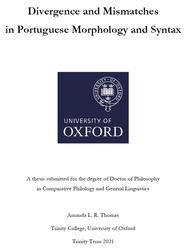 Divergence and Mismatches in Portuguese Morphology and Syntax, Thomas L.R., 2021 — This thesis proposes an integration of Paradigm Function Morphology (PFM) as the morphological component within the Lexical-Functional Grammar (LFG) architecture, … Книги по английскому языку

